


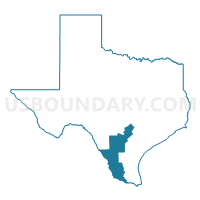
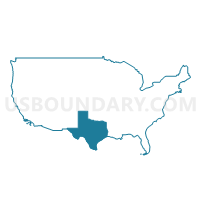
Congressional District 28, Texas
About
Outline

Summary
| Unique Area Identifier | 119082 |
| Name | Congressional District 28 |
| State | Texas |
| Area (square miles) | 13,738.29 |
| Land Area (square miles) | 13,613.13 |
| Water Area (square miles) | 125.16 |
| % of Land Area | 99.09 |
| % of Water Area | 0.91 |
| Latitude of the Internal Point | 27.98999500 |
| Longtitude of the Internal Point | -98.87945800 |
| Total Population | 851,824 |
| Total Housing Units | 283,316 |
| Total Households | 250,308 |
| Median Age | 30.4 |
Maps
Graphs
Select a template below for downloading or customizing gragh for Congressional District 28, Texas


Neighbors
Neighoring 111th Congressional District (by Name) Neighboring 111th Congressional District on the Map
- Congressional District 15, TX
- Congressional District 21, TX
- Congressional District 23, TX
- Congressional District 25, TX
Top 10 Neighboring County (by Population) Neighboring County on the Map
- Bexar County, TX (1,714,773)
- Hidalgo County, TX (774,769)
- Webb County, TX (250,304)
- Hays County, TX (157,107)
- Guadalupe County, TX (131,533)
- Comal County, TX (108,472)
- Starr County, TX (60,968)
- Maverick County, TX (54,258)
- Medina County, TX (46,006)
- Atascosa County, TX (44,911)
Top 10 Neighboring County Subdivision (by Population) Neighboring County Subdivision on the Map
- McAllen-Pharr CCD, Hidalgo County, TX (267,929)
- San Antonio Northeast CCD, Bexar County, TX (233,237)
- Mission CCD, Hidalgo County, TX (158,485)
- San Antonio West CCD, Bexar County, TX (156,349)
- Laredo CCD, Webb County, TX (152,811)
- Southeast Hidalgo CCD, Hidalgo County, TX (125,614)
- Schertz-Cibolo CCD, Guadalupe County, TX (69,576)
- Laredo South-El Cenizo CCD, Webb County, TX (67,228)
- New Braunfels CCD, Comal County, TX (63,736)
- San Marcos CCD, Hays County, TX (55,314)
Top 10 Neighboring Place (by Population) Neighboring Place on the Map
- San Antonio city, TX (1,327,407)
- Laredo city, TX (236,091)
- McAllen city, TX (129,877)
- Mission city, TX (77,058)
- Pharr city, TX (70,400)
- New Braunfels city, TX (57,740)
- San Marcos city, TX (44,894)
- San Juan city, TX (33,856)
- Schertz city, TX (31,465)
- Seguin city, TX (25,175)
Top 10 Neighboring Unified School District (by Population) Neighboring Unified School District on the Map
- United Independent School District, TX (156,720)
- Edinburg Consolidated Independent School District, TX (137,053)
- Pharr-San Juan-Alamo Independent School District, TX (121,264)
- McAllen Independent School District, TX (119,220)
- Judson Independent School District, TX (113,801)
- Comal Independent School District, TX (99,194)
- La Joya Independent School District, TX (93,891)
- Laredo Independent School District, TX (92,261)
- San Marcos Consolidated Independent School District, TX (64,257)
- Mission Consolidated Independent School District, TX (61,468)
Top 10 Neighboring State Legislative District Lower Chamber (by Population) Neighboring State Legislative District Lower Chamber on the Map
- State House District 117, TX (220,360)
- State House District 40, TX (215,412)
- State House District 45, TX (205,670)
- State House District 36, TX (201,386)
- State House District 44, TX (194,258)
- State House District 73, TX (187,204)
- State House District 41, TX (185,698)
- State House District 39, TX (172,273)
- State House District 42, TX (171,951)
- State House District 31, TX (165,121)
Top 10 Neighboring State Legislative District Upper Chamber (by Population) Neighboring State Legislative District Upper Chamber on the Map
- State Senate District 25, TX (984,664)
- State Senate District 18, TX (861,831)
- State Senate District 20, TX (836,938)
- State Senate District 27, TX (786,946)
- State Senate District 19, TX (766,044)
- State Senate District 21, TX (752,602)
Top 10 Neighboring Census Tract (by Population) Neighboring Census Tract on the Map
- Census Tract 213.02, Hidalgo County, TX (15,668)
- Census Tract 242.01, Hidalgo County, TX (14,553)
- Census Tract 241.12, Hidalgo County, TX (12,663)
- Census Tract 17.13, Webb County, TX (12,304)
- Census Tract 205.03, Hidalgo County, TX (11,541)
- Census Tract 241.06, Hidalgo County, TX (10,305)
- Census Tract 203.01, Hidalgo County, TX (9,984)
- Census Tract 217.01, Hidalgo County, TX (9,945)
- Census Tract 241.10, Hidalgo County, TX (9,893)
- Census Tract 203.02, Hidalgo County, TX (9,667)
Top 10 Neighboring 5-Digit ZIP Code Tabulation Area (by Population) Neighboring 5-Digit ZIP Code Tabulation Area on the Map
- 78572, TX (75,221)
- 78577, TX (70,840)
- 78046, TX (64,548)
- 78666, TX (63,836)
- 78501, TX (61,219)
- 78130, TX (59,546)
- 78574, TX (57,071)
- 78045, TX (54,713)
- 78852, TX (53,040)
- 78223, TX (50,637)
Data
Demographic, Population, Households, and Housing Units
** Data sources from census 2010 **
Show Data on Map
Download Full List as CSV
Download Quick Sheet as CSV
| Subject | This Area | Texas | National |
|---|---|---|---|
| POPULATION | |||
| Total Population Map | 851,824 | 25,145,561 | 308,745,538 |
| POPULATION, HISPANIC OR LATINO ORIGIN | |||
| Not Hispanic or Latino Map | 179,695 | 15,684,640 | 258,267,944 |
| Hispanic or Latino Map | 672,129 | 9,460,921 | 50,477,594 |
| POPULATION, RACE | |||
| White alone Map | 748,669 | 17,701,552 | 223,553,265 |
| Black or African American alone Map | 13,116 | 2,979,598 | 38,929,319 |
| American Indian and Alaska Native alone Map | 3,662 | 170,972 | 2,932,248 |
| Asian alone Map | 6,502 | 964,596 | 14,674,252 |
| Native Hawaiian and Other Pacific Islander alone Map | 298 | 21,656 | 540,013 |
| Some Other Race alone Map | 65,637 | 2,628,186 | 19,107,368 |
| Two or More Races Map | 13,940 | 679,001 | 9,009,073 |
| POPULATION, SEX | |||
| Male Map | 417,499 | 12,472,280 | 151,781,326 |
| Female Map | 434,325 | 12,673,281 | 156,964,212 |
| POPULATION, AGE (18 YEARS) | |||
| 18 years and over Map | 573,303 | 18,279,737 | 234,564,071 |
| Under 18 years | 278,521 | 6,865,824 | 74,181,467 |
| POPULATION, AGE | |||
| Under 5 years | 75,105 | 1,928,473 | 20,201,362 |
| 5 to 9 years | 78,712 | 1,928,234 | 20,348,657 |
| 10 to 14 years | 77,928 | 1,881,883 | 20,677,194 |
| 15 to 17 years | 46,776 | 1,127,234 | 12,954,254 |
| 18 and 19 years | 28,170 | 755,890 | 9,086,089 |
| 20 years | 12,403 | 369,040 | 4,519,129 |
| 21 years | 11,736 | 359,015 | 4,354,294 |
| 22 to 24 years | 33,909 | 1,089,024 | 12,712,576 |
| 25 to 29 years | 56,185 | 1,853,039 | 21,101,849 |
| 30 to 34 years | 55,826 | 1,760,434 | 19,962,099 |
| 35 to 39 years | 58,877 | 1,763,587 | 20,179,642 |
| 40 to 44 years | 56,148 | 1,694,795 | 20,890,964 |
| 45 to 49 years | 52,956 | 1,760,467 | 22,708,591 |
| 50 to 54 years | 47,439 | 1,674,869 | 22,298,125 |
| 55 to 59 years | 40,149 | 1,422,924 | 19,664,805 |
| 60 and 61 years | 15,038 | 500,523 | 7,113,727 |
| 62 to 64 years | 20,305 | 674,244 | 9,704,197 |
| 65 and 66 years | 11,668 | 373,062 | 5,319,902 |
| 67 to 69 years | 15,297 | 480,038 | 7,115,361 |
| 70 to 74 years | 20,780 | 619,156 | 9,278,166 |
| 75 to 79 years | 15,644 | 477,245 | 7,317,795 |
| 80 to 84 years | 11,461 | 347,206 | 5,743,327 |
| 85 years and over | 9,312 | 305,179 | 5,493,433 |
| MEDIAN AGE BY SEX | |||
| Both sexes Map | 30.40 | 33.60 | 37.20 |
| Male Map | 29.10 | 32.60 | 35.80 |
| Female Map | 31.80 | 34.60 | 38.50 |
| HOUSEHOLDS | |||
| Total Households Map | 250,308 | 8,922,933 | 116,716,292 |
| HOUSEHOLDS, HOUSEHOLD TYPE | |||
| Family households: Map | 204,242 | 6,237,148 | 77,538,296 |
| Husband-wife family Map | 147,368 | 4,515,013 | 56,510,377 |
| Other family: Map | 56,874 | 1,722,135 | 21,027,919 |
| Male householder, no wife present Map | 13,777 | 467,431 | 5,777,570 |
| Female householder, no husband present Map | 43,097 | 1,254,704 | 15,250,349 |
| Nonfamily households: Map | 46,066 | 2,685,785 | 39,177,996 |
| Householder living alone Map | 38,831 | 2,163,266 | 31,204,909 |
| Householder not living alone Map | 7,235 | 522,519 | 7,973,087 |
| HOUSEHOLDS, HISPANIC OR LATINO ORIGIN OF HOUSEHOLDER | |||
| Not Hispanic or Latino householder: Map | 70,385 | 6,308,776 | 103,254,926 |
| Hispanic or Latino householder: Map | 179,923 | 2,614,157 | 13,461,366 |
| HOUSEHOLDS, RACE OF HOUSEHOLDER | |||
| Householder who is White alone | 221,813 | 6,570,152 | 89,754,352 |
| Householder who is Black or African American alone | 4,272 | 1,088,836 | 14,129,983 |
| Householder who is American Indian and Alaska Native alone | 1,155 | 57,265 | 939,707 |
| Householder who is Asian alone | 1,776 | 307,373 | 4,632,164 |
| Householder who is Native Hawaiian and Other Pacific Islander alone | 81 | 6,353 | 143,932 |
| Householder who is Some Other Race alone | 17,352 | 714,396 | 4,916,427 |
| Householder who is Two or More Races | 3,859 | 178,558 | 2,199,727 |
| HOUSEHOLDS, HOUSEHOLD TYPE BY HOUSEHOLD SIZE | |||
| Family households: Map | 204,242 | 6,237,148 | 77,538,296 |
| 2-person household Map | 55,762 | 2,283,002 | 31,882,616 |
| 3-person household Map | 41,947 | 1,417,977 | 17,765,829 |
| 4-person household Map | 44,850 | 1,286,463 | 15,214,075 |
| 5-person household Map | 32,210 | 709,450 | 7,411,997 |
| 6-person household Map | 15,469 | 307,995 | 3,026,278 |
| 7-or-more-person household Map | 14,004 | 232,261 | 2,237,501 |
| Nonfamily households: Map | 46,066 | 2,685,785 | 39,177,996 |
| 1-person household Map | 38,831 | 2,163,266 | 31,204,909 |
| 2-person household Map | 5,993 | 420,415 | 6,360,012 |
| 3-person household Map | 787 | 64,352 | 992,156 |
| 4-person household Map | 247 | 26,532 | 411,171 |
| 5-person household Map | 118 | 6,926 | 126,634 |
| 6-person household Map | 57 | 2,610 | 48,421 |
| 7-or-more-person household Map | 33 | 1,684 | 34,693 |
| HOUSING UNITS | |||
| Total Housing Units Map | 283,316 | 9,977,436 | 131,704,730 |
| HOUSING UNITS, OCCUPANCY STATUS | |||
| Occupied Map | 250,308 | 8,922,933 | 116,716,292 |
| Vacant Map | 33,008 | 1,054,503 | 14,988,438 |
| HOUSING UNITS, OCCUPIED, TENURE | |||
| Owned with a mortgage or a loan Map | 99,189 | 3,728,987 | 52,979,430 |
| Owned free and clear Map | 80,750 | 1,956,366 | 23,006,644 |
| Renter occupied Map | 70,369 | 3,237,580 | 40,730,218 |
| HOUSING UNITS, VACANT, VACANCY STATUS | |||
| For rent Map | 5,915 | 394,310 | 4,137,567 |
| Rented, not occupied Map | 505 | 16,509 | 206,825 |
| For sale only Map | 3,463 | 121,430 | 1,896,796 |
| Sold, not occupied Map | 911 | 30,437 | 421,032 |
| For seasonal, recreational, or occasional use Map | 10,852 | 208,733 | 4,649,298 |
| For migrant workers Map | 199 | 2,209 | 24,161 |
| Other vacant Map | 11,163 | 280,875 | 3,652,759 |
| HOUSING UNITS, OCCUPIED, AVERAGE HOUSEHOLD SIZE BY TENURE | |||
| Total: Map | 3.35 | 2.75 | 2.58 |
| Owner occupied Map | 3.38 | 2.87 | 2.65 |
| Renter occupied Map | 3.26 | 2.54 | 2.44 |
| HOUSING UNITS, OCCUPIED, TENURE BY RACE OF HOUSEHOLDER | |||
| Owner occupied: Map | 179,939 | 5,685,353 | 75,986,074 |
| Householder who is White alone Map | 161,863 | 4,517,967 | 63,446,275 |
| Householder who is Black or African American alone Map | 2,907 | 486,371 | 6,261,464 |
| Householder who is American Indian and Alaska Native alone Map | 757 | 32,734 | 509,588 |
| Householder who is Asian alone Map | 1,115 | 190,121 | 2,688,861 |
| Householder who is Native Hawaiian and Other Pacific Islander alone Map | 59 | 3,003 | 61,911 |
| Householder who is Some Other Race alone Map | 10,718 | 361,514 | 1,975,817 |
| Householder who is Two or More Races Map | 2,520 | 93,643 | 1,042,158 |
| Renter occupied: Map | 70,369 | 3,237,580 | 40,730,218 |
| Householder who is White alone Map | 59,950 | 2,052,185 | 26,308,077 |
| Householder who is Black or African American alone Map | 1,365 | 602,465 | 7,868,519 |
| Householder who is American Indian and Alaska Native alone Map | 398 | 24,531 | 430,119 |
| Householder who is Asian alone Map | 661 | 117,252 | 1,943,303 |
| Householder who is Native Hawaiian and Other Pacific Islander alone Map | 22 | 3,350 | 82,021 |
| Householder who is Some Other Race alone Map | 6,634 | 352,882 | 2,940,610 |
| Householder who is Two or More Races Map | 1,339 | 84,915 | 1,157,569 |
| HOUSING UNITS, OCCUPIED, TENURE BY HISPANIC OR LATINO ORIGIN OF HOUSEHOLDER | |||
| Owner occupied: Map | 179,939 | 5,685,353 | 75,986,074 |
| Not Hispanic or Latino householder Map | 55,758 | 4,175,029 | 69,617,625 |
| Hispanic or Latino householder Map | 124,181 | 1,510,324 | 6,368,449 |
| Renter occupied: Map | 70,369 | 3,237,580 | 40,730,218 |
| Not Hispanic or Latino householder Map | 14,627 | 2,133,747 | 33,637,301 |
| Hispanic or Latino householder Map | 55,742 | 1,103,833 | 7,092,917 |
| HOUSING UNITS, OCCUPIED, TENURE BY HOUSEHOLD SIZE | |||
| Owner occupied: Map | 179,939 | 5,685,353 | 75,986,074 |
| 1-person household Map | 24,028 | 1,047,772 | 16,453,569 |
| 2-person household Map | 47,604 | 1,900,981 | 27,618,605 |
| 3-person household Map | 30,454 | 975,846 | 12,517,563 |
| 4-person household Map | 32,850 | 911,187 | 10,998,793 |
| 5-person household Map | 23,659 | 486,511 | 5,057,765 |
| 6-person household Map | 11,251 | 207,414 | 1,965,796 |
| 7-or-more-person household Map | 10,093 | 155,642 | 1,373,983 |
| Renter occupied: Map | 70,369 | 3,237,580 | 40,730,218 |
| 1-person household Map | 14,803 | 1,115,494 | 14,751,340 |
| 2-person household Map | 14,151 | 802,436 | 10,624,023 |
| 3-person household Map | 12,280 | 506,483 | 6,240,422 |
| 4-person household Map | 12,247 | 401,808 | 4,626,453 |
| 5-person household Map | 8,669 | 229,865 | 2,480,866 |
| 6-person household Map | 4,275 | 103,191 | 1,108,903 |
| 7-or-more-person household Map | 3,944 | 78,303 | 898,211 |
Loading...